The 2020 TIAA Institute-GFLEC Personal Finance Index

Many Do Not Know What They Do and Do Not Know

Introduction

Americans' financial literacy, while remaining low overall, has improved slightly in recent years. 

Summary

The 2020 TIAA Institute-GFLEC Personal Finance Index (P-Fin Index), part of a long-term study to gauge U.S. adults’ financial literacy, is unique in its capacity to produce a robust measure of overall personal finance knowledge plus a nuanced analysis of financial literacy across eight functional areas. The 2020 wave of the study contains several new questions, for example, individuals were asked to evaluate their financial knowledge and they were asked about the amount of time they spend dealing with financial issues while at work.

Key Insights

  • U.S. adults, on average, correctly answered 52% of the P-Fin Index questions.
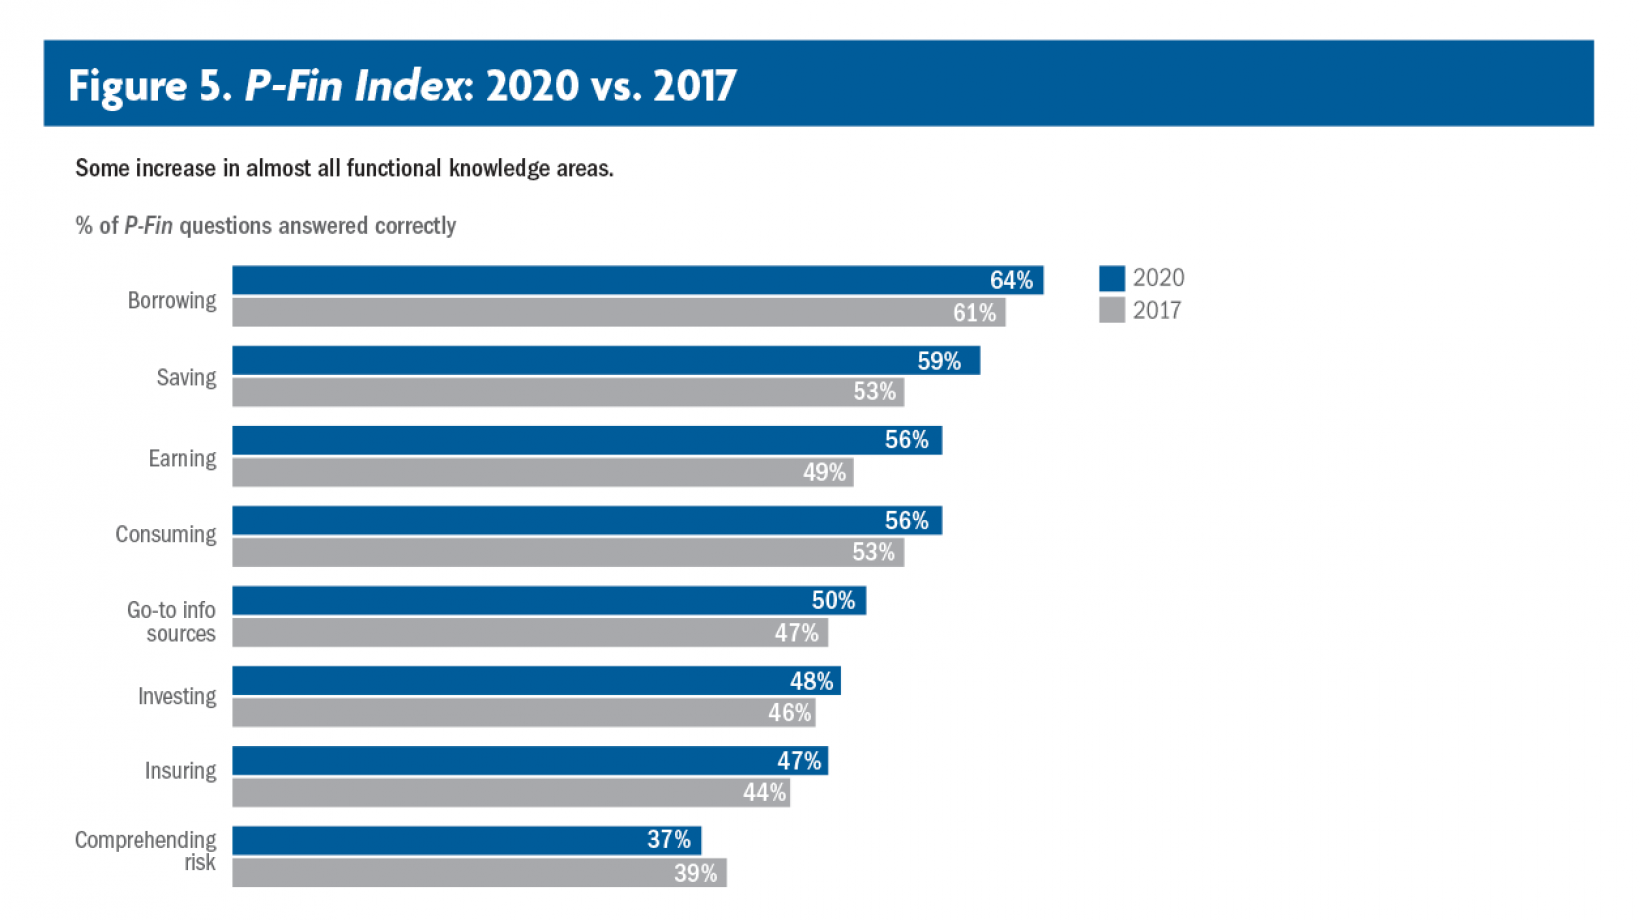
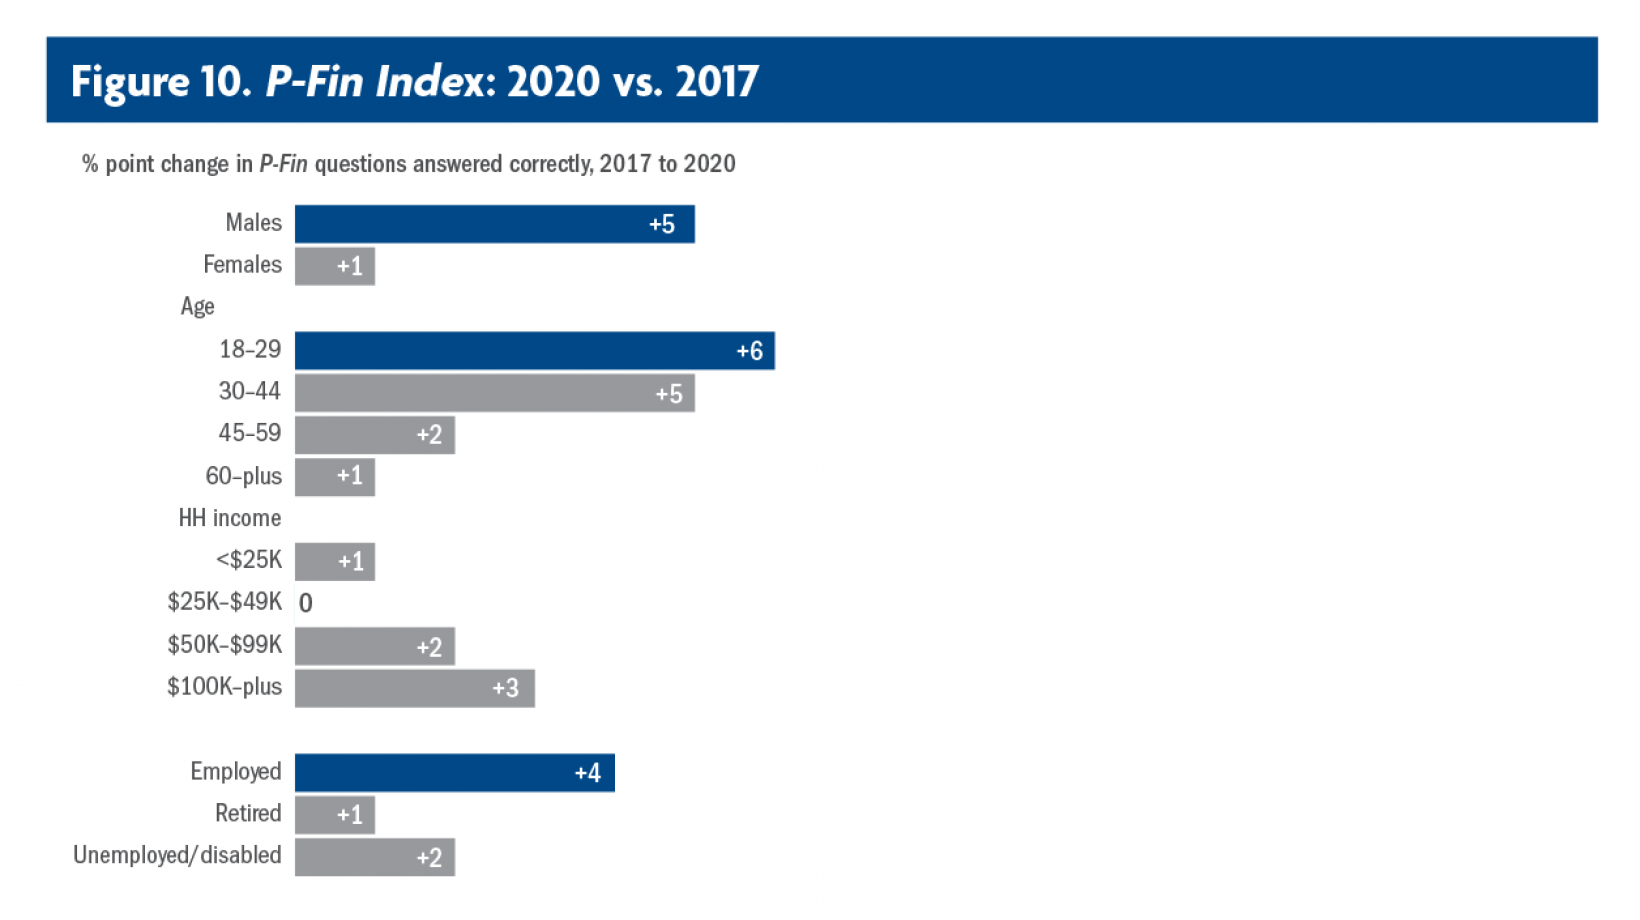
  • Correct responses have risen by 1 percentage point each year since the inaugural survey in 2017, resulting in a statistically significant increase over this period.
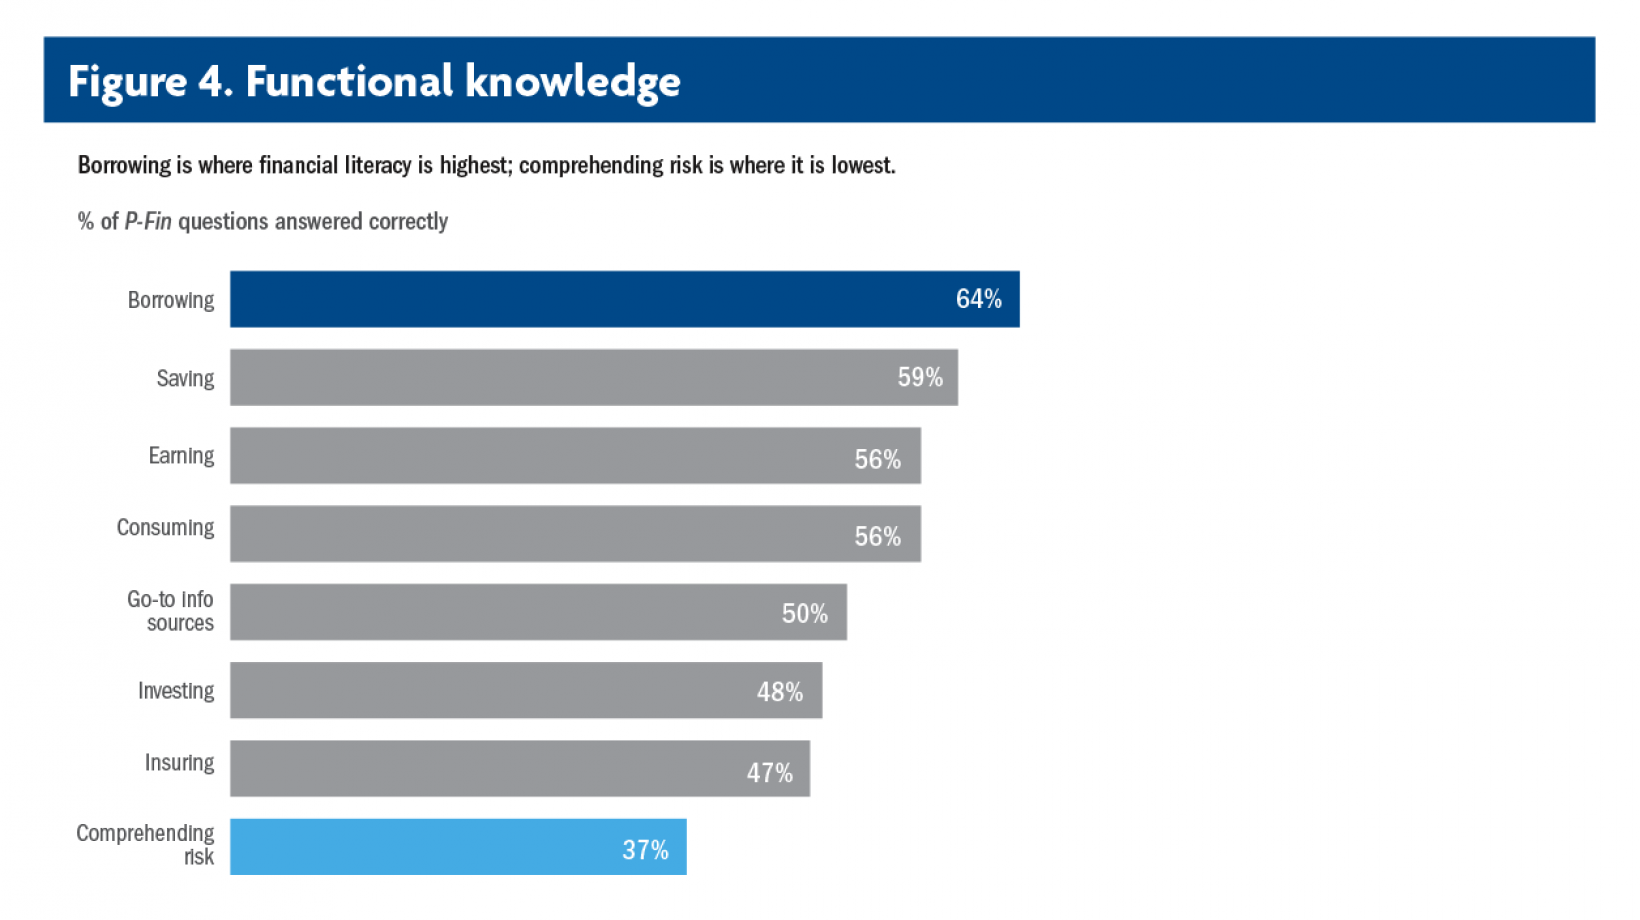
  • Financial knowledge is lowest in the area of comprehending risk and highest in borrowing and debt management. 
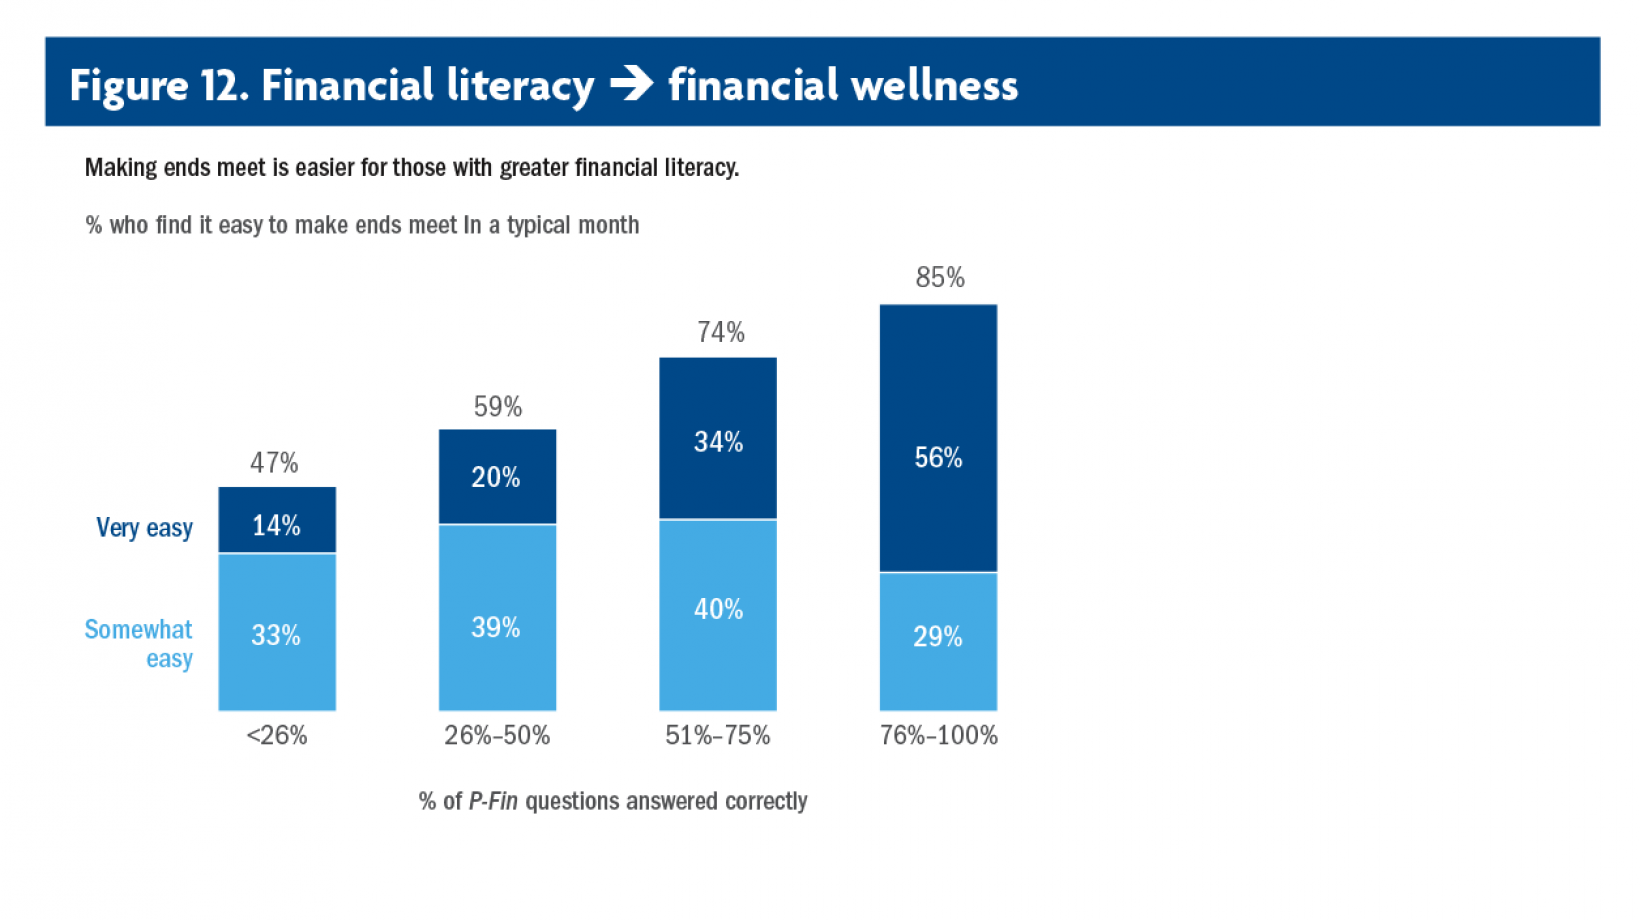
  • Individuals with greater financial literacy spend less time at work contemplating money management problems. 
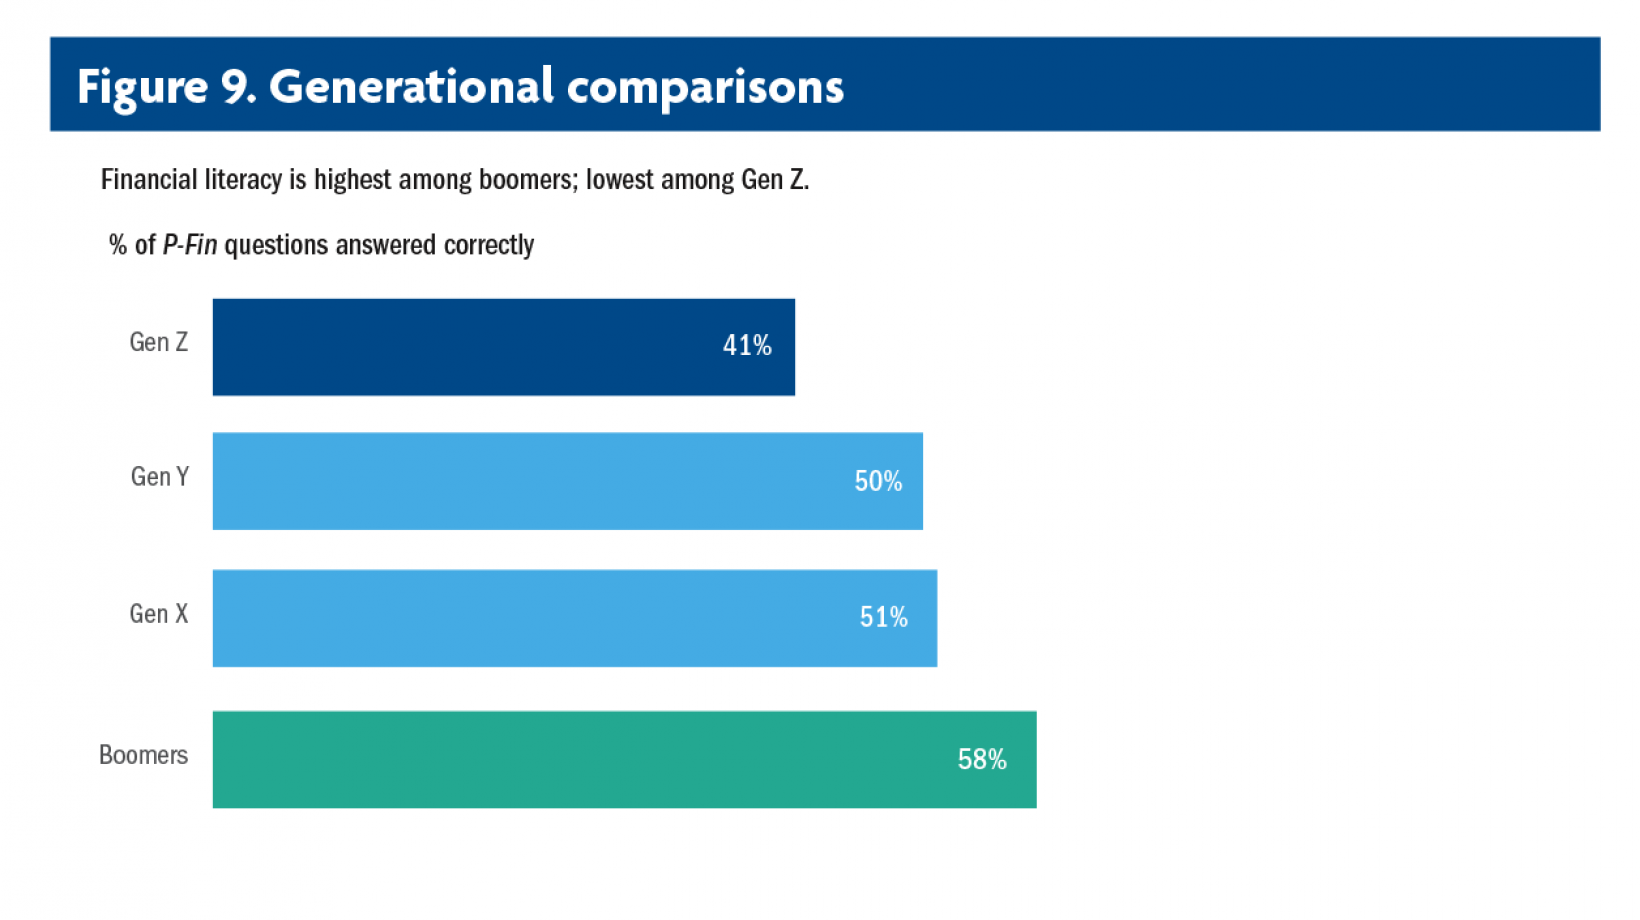
  • Financial literacy is notably lower among Gen Z compared with older generations.

Methodology

A nationally representative sample of 1,008 U.S. adults, ages 18 and older, completed the 2020 P-Fin Index survey online in January 2020. A sufficient number of Gen Z and Gen Y respondents were sampled to allow for comparisons of financial literacy across generations as well as within age groups.

Explore Report Content

Executive Summary

The 2020 TIAA Institute-GFLEC Personal Finance Index (P-Fin Index) is part of a long-term project that annually assesses financial literacy among U.S. adults. The P-Fin Index is unique in its capacity to produce a robust measure of overall personal finance knowledge plus a nuanced analysis of financial literacy across eight functional areas in which individuals routinely operate.

Introduction

Financial literacy is knowledge and understanding that enable sound financial decision making and effective management of personal finances. Thus, an individual’s financial wellness depends, at least in part, on his or her financial literacy.

Overall Financial Literacy

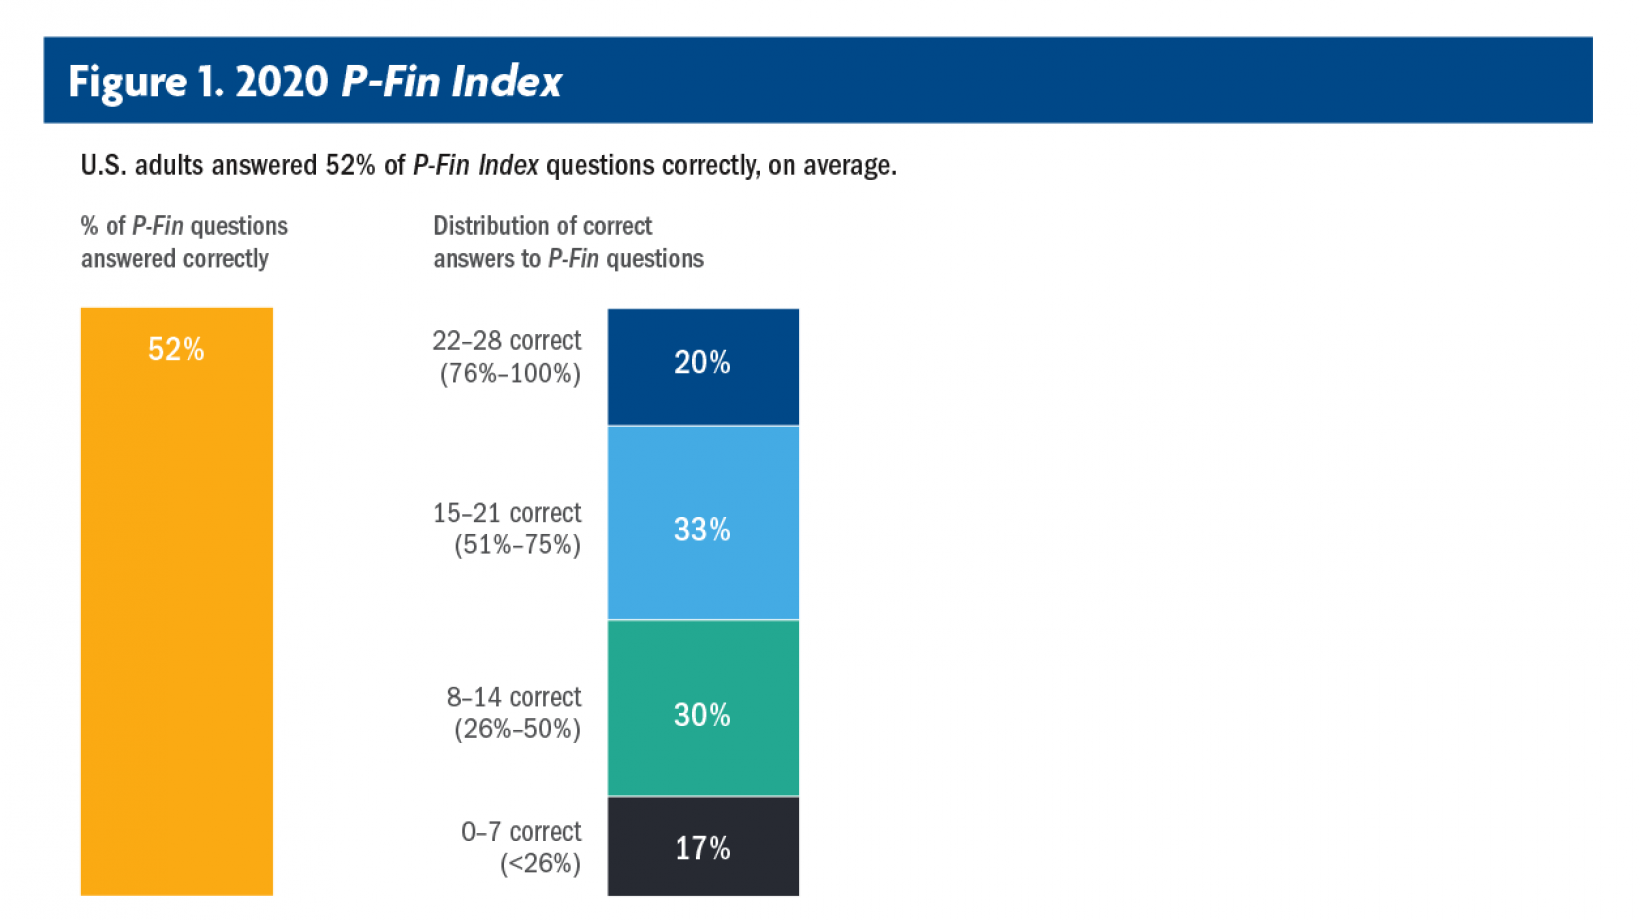
Many Americans lack personal finance knowledge that enables sound financial decision making. On average, U.S. adults answered 52% of the P-Fin Index questions correctly in 2020. In addition, there is close to a 50/50 split between those who correctly answered over one-half of the index questions (53%) and those who correctly answered one-half or less (47%) (Figure 1). Twenty percent demonstrated a relatively high level of financial literacy, i.e., they correctly answered more than 75% of the index questions, while 17% showed a relatively low level, i.e., they correctly answered 25% or fewer of the questions.

financial-literacy

Functional Knowledge

Turning to the eight functional areas that comprise the P-Fin Index, comprehending risk is where financial literacy tends to be lowest among U.S. adults. Comprehending risk involves, for example, understanding that the expected outcome in a given scenario depends on the range of possible outcomes, the financial implication associated with each outcome and the likelihood of each outcome occurring. On average, 37% of these questions were answered correctly (Figure 4).

financial-literacy

Changes Over Time

Relative rankings of functional knowledge based on the percentage of correctly answered questions remains almost unchanged between the 2017 and 2020 P-Fin Indices (Figure 5). Borrowing is where knowledge is highest in each year of the index. Seven functional areas have seen an increased percentage of correctly answered questions, some marginal and others more noteworthy—correct answers increased 7 percentage points for earning and 6 percentage points for savings. The 3-percentage point increase for go-to information sources is also statistically significant. The one area with a decrease (2 percentage points) in the percentage of correctly answered questions is where financial literacy has been lowest in all four years—comprehending risk. This decrease was not statistically significant.

financial-literacy

Self-Perceptions

Many individuals do not know what they do know in terms of financial literacy. Consuming and earning are the areas where the largest share of adults rate their financial knowledge as being highest (25% and 22%, respectively) (Figure 6). While these are areas of relative strength in terms of financial literacy (Figure 4), clearly many individuals do not recognize the level of knowledge they possess regarding borrowing. While borrowing is the area of greatest functional knowledge among U.S. adults, only 10% rate themselves most knowledgeable in this area, the same percentage that rate themselves least knowledgeable. Perhaps challenges individuals face in managing debt are viewed as signaling a lack of knowledge.

financial-literacy

Demographic Variations

Financial literacy varies across demographic groups (Figure 7), consistent with variations identified in previous years of the P-Fin Index and other studies.

- There is a 7-percentage point difference between men and women in correctly answered P-Fin Index questions. This difference is highly statistically significant.

- There is a difference of 11 percentage points in correctly answered questions among adults age 45 and older (58% correct, on average) compared with those under age 45 (47% correct). This difference is statistically significant.

- Financial literacy increases as household income increases; the difference between each successive income group is statistically significant. The gap in correctly answered questions between those with household incomes below $25,000 and those with household incomes of $100,000 or more is 27 percentage points.

- Financial literacy varies with employment status. In particular, those unemployed or disabled have significantly less personal finance knowledge than those employed and those retired.

financial-literacy

Generational Differences

Financial literacy comparisons across Gen Z, Gen Y (millennials), Gen X and baby boomers are possible with the P-Fin Index for the first time in 2020. Financial literacy is notably lower among Gen Z compared with the other generations; Gen Z correctly answered 41% of the index questions on average (Figure 9). Financial literacy is greatest among baby boomers; on average, boomers correctly answered 58% of the index questions. It should be noted that we cannot differentiate between age and generation effects with a single cross-section of data, so this is only suggestive of generational differences.

financial-literacy

2017-2020 Changes

Figure 10 shows the percentage point change between 2017 and 2020 in P-Fin Index questions answered correctly across demographic groups. It is important to note that sample sizes decrease as the sample of all adults is divided into subgroups, resulting in increased variance in the estimates. Keeping that in mind, financial literacy levels have increased significantly among men, those age 18-29, and among those employed.

financial-literacy

Financial Wellness and the P-Fin Index

Achieving financial security, or financial well-being, is a goal shared across individuals. An increased employer focus on employee financial well-being has manifested itself in workplace financial wellness programs. These programs are more holistic than predecessor programs, which typically focused on a single aspect of personal finances, e.g., saving for retirement or investing in retirement accounts.

financial-literacy

Financial Literacy and Advice

Receiving professional financial advice should also improve an individual’s financial wellness. Access to financial advice may occur at work through a financial wellness program or a retirement savings plan or, alternatively, an individual may seek out an advisor outside the context of work.

financial-literacy

Discussion

The first four years of the P-Fin Index hint at a slow increase over time in financial literacy among U.S. adults. The percentage of index questions answered correctly has increased 1 percentage point each year from 2017 to 2020, rising from 49% to 52%. The percentage of adults correctly answering more than one-half of the index questions increased from 48% to 53% over this period, and the percentage correctly answering more than 75% rose from 16% to 20%. Each of these differences in financial literacy between 2017 and 2020 is statistically significant.

Download The 2020 TIAA Institute-GFLEC Personal Finance Index April 2020Opens pdf

Authors

Paul Yakoboski

TIAA Institute

Annamaria Lusardi

GFLEC, The George Washington University

Andrea Hasler

GFLEC, The George Washington University